NexaGPU NexaGPU

How to Choose a Data Center AI Server Manufacturer?

Time:2026-09-25 Author:Amelia
0%

Choosing a data center AI server manufacturer is no longer a simple comparison of processor specifications. Training and inference workloads place concentrated demands on accelerators, memory, networking, and power delivery. Not just speed. A system that performs well in a benchmark may still create problems when it must run continuously inside a specific facility.

The International Energy Agency’s Electricity 2024 report estimated that data centers used about 460 terawatt-hours of electricity worldwide in 2022. It projected consumption could reach 620–1,050 terawatt-hours by 2026, while noting uncertainty around future demand. That range makes efficiency more than a marketing claim. Buyers should ask manufacturers for measured power and thermal data under workloads resembling their own, rather than relying only on peak-performance figures. Uptime Institute’s Global Data Center Survey 2024 also highlights the practical importance of power, cooling, and operational resilience. These factors connect server design directly to site capacity and uptime.

This guide examines how to assess a data center ai server manufacturer across workload fit, accelerator options, liquid-cooling readiness, network design, serviceability, and long-term support. It also considers firmware, security practices, component availability, and clear warranty terms. Ask for test methods and deployment references. Verify the details. A polished specification sheet is useful, but it cannot replace evidence from comparable installations. Not every buyer needs the newest platform, and I would treat broad efficiency promises cautiously until they are backed by transparent measurements.
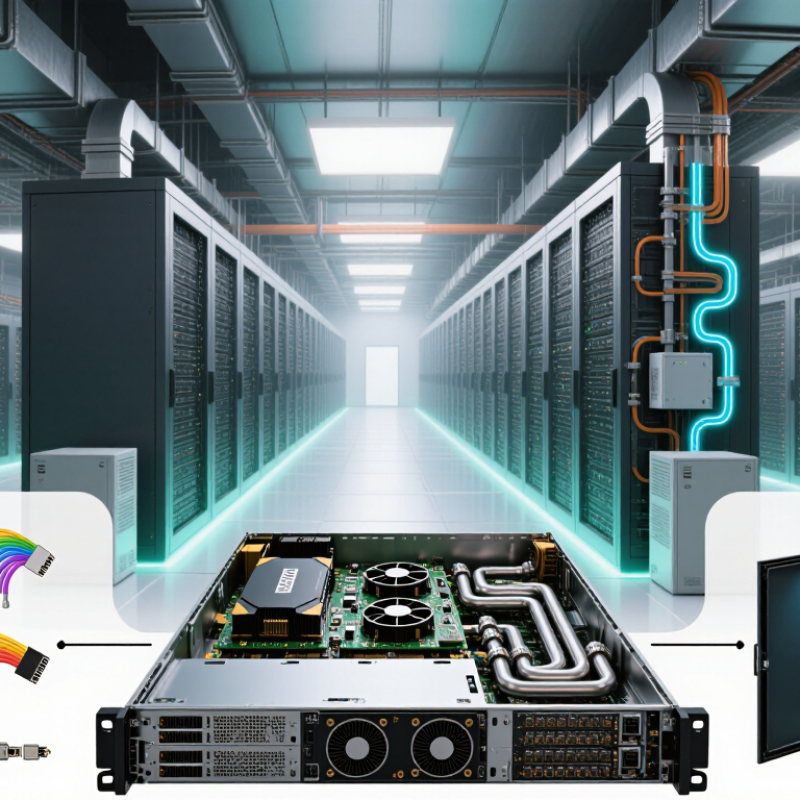
How to Choose a Data Center AI Server Manufacturer?

Define AI Workloads and GPU Scale Before Comparing Server Manufacturers

Before comparing server manufacturers, define the AI workload in measurable terms. Training and inference need different balances of compute, memory, networking, and latency. Record model size, numerical precision, expected user concurrency, and whether jobs run continuously or in short bursts. A training cluster may need fast links between GPUs; an inference service may depend more on predictable response times and memory capacity. Small details matter, such as fitting cables and airflow paths around a fully populated rack.

The Stanford AI Index 2024 reports that training compute for notable AI models has doubled roughly every five months. Compute grows fast. Estimate today’s GPU count, then model likely growth over the next three years. The International Energy Agency’s Electricity 2024 report says data center electricity use could exceed 1,000 TWh by 2026, making power and cooling essential comparison points. Ask manufacturers for measured performance, rack power, cooling requirements, and expansion limits under your own workload. That estimate is imperfect. Published benchmark results may not reflect your data, software, or utilization; I would treat them as a starting point, not a promise. When the workload and scale are clear, proposals become easier to compare fairly.

Benchmark Vendor Performance Against MLPerf Training v5.0 Results

When choosing a data center AI server manufacturer, treat MLPerf Training v5.0 as evidence, not a shopping list. Compare results for the same workload and target quality; a faster run on one task may not predict performance on yours. Read the system details, including accelerator count, memory, interconnect, and software configuration. These can explain why two results differ. Check whether the vendor’s tested configuration matches the server it is offering, and ask for repeatable results under your expected workload. Details matter.

Tips: Record the benchmark score, system configuration, and submission notes side by side. Ask for a live demonstration using your model and dataset. Small gaps in setup can change outcomes.

Benchmark numbers do not show the whole operating picture. Ask how the server handles sustained training, cooling, job scheduling, and recovery after a failed run. Request evidence from tests beyond the headline result, such as utilization logs and repeat runs. A quieter rack and predictable job completion can matter more than a narrow benchmark lead. I would also question any claim that lacks a clearly documented configuration. That is not always easy to verify. MLPerf results are useful, but buyers still need to validate fit in their own environment.

Plan Power Capacity for NVIDIA GB200 NVL72 Racks Rated Near 120 kW

A rack rated near 120 kW needs a power plan built around measured IT load, not a nameplate estimate alone. Uptime Institute’s 2024 Global Data Center Survey put typical rack density at roughly 8 kW, making a 120 kW deployment far beyond conventional planning assumptions. At 415 volts, three-phase power, 120 kW draws about 167 amps per phase at unity power factor. Real installations need allowances for power factor, conversion losses, redundancy, and future load changes. Leave room. Confirm the usable capacity of each UPS, panel, busway, and branch circuit before specifying the rack.

Cooling deserves equal attention. A 120 kW rack releases roughly 120 kW of heat, or about 409,000 Btu per hour, into the data hall. Air cooling may not handle that concentration reliably; evaluate direct liquid cooling, coolant distribution, leak detection, and service access with the equipment manufacturer. Check flow and temperature requirements against the facility’s actual operating conditions. A paper design can look fine. A poorly placed pipe or undersized return path can still constrain deployment.

Ask prospective suppliers for load profiles, peak and idle power figures, rack-level distribution drawings, and commissioning test results. Validate those figures with a site power study and thermal review. Keep a margin for transient loads, but avoid oversizing blindly; unused capacity also has a cost. Reported averages are useful context, not a substitute for measurements at your site.

Compare Cooling Efficiency with Uptime Institute’s 1.56 Average PUE

When choosing a data center AI server manufacturer, compare cooling claims against a clear baseline. Uptime Institute’s 2024 Global Data Center Survey reported an average PUE of 1.56 for 2023. Treat this as context, not a server-level target: PUE measures total facility energy against IT energy. A manufacturer’s efficiency figure needs its own boundary, workload, and ambient conditions stated.

Ask for measurements at idle and sustained AI workloads. Check server power, fan energy, inlet temperatures, and thermal throttling—not just peak performance. The benchmark is imperfect. Facility climate, rack layout, and utilization can shift results, even with identical hardware. A demo proves little.

ASHRAE TC 9.9 guidance gives 18–27°C as the recommended inlet range for many air-cooled equipment classes; accelerator-specific limits may differ. Request test logs showing rack-inlet temperatures and, for liquid-cooled systems, coolant supply temperatures under sustained load. Compare results under matching conditions, and ask how performance changes when cooling demand rises. A modest claim with reproducible test data is more useful than an impressive PUE estimate attributed to one server.

Verify Service Coverage, Reliability, and Five-Year Total Cost of Ownership

How to Choose a Data Center AI Server Manufacturer?
Verify Service Coverage, Reliability, and Five-Year Total Cost of Ownership

Service promises matter only when they cover your actual sites. Ask for written response times, regional parts locations, escalation paths, and support hours. Uptime Institute’s 2024 Annual Outage Analysis found that 54% of surveyed operators said their most recent significant outage cost more than $100,000. That makes repair speed a financial issue, not just a technical detail. Parts must move.

Build a five-year cost model that includes purchase price, electricity, cooling, maintenance, software, and downtime. Lawrence Berkeley National Laboratory’s 2024 report estimates U.S. data centers used 176 TWh of electricity in 2023, about 4.4% of national use. For AI servers, compare measured power under your expected workload, not just peak specifications. Small efficiency gaps compound across racks and years.

Check reliability evidence such as failure rates, burn-in procedures, firmware updates, and replacement-part availability. Ask how support works during nights, weekends, and simultaneous failures. No model catches every surprise. I would keep a contingency budget; spreadsheets rarely predict a delayed component or an unexpected cooling adjustment. Compare suppliers using the same workload, energy assumptions, and service requirements, then review the figures with your facilities and operations teams.

How to Choose a Data Center AI Server Manufacturer? Verify Service Coverage, Reliability, and Five-Year Total Cost of Ownership

Use this comparison framework to evaluate service commitments, reliability evidence, and five-year cost for equivalent AI server bids.

Illustrative bid comparison — generic supplier profiles, not manufacturer claims or quotations
Evaluation dimension Option A Option B Option C
Service coverage and support
Service footprint in the deployment region Local parts depot; onsite service limited to the metropolitan area National coverage through regional service locations Multi-region coverage; confirm named locations and subcontractor arrangements
Illustrative onsite response commitment Next business day 4 hours for covered sites 4 hours for covered sites
Coverage window to verify Business hours; confirm holiday and after-hours terms 24 × 7 for critical incidents, subject to contract 24 × 7 for critical incidents, subject to contract
Parts and escalation checks Confirm local stock for GPUs, power supplies, fans, and system boards Request regional stock levels and escalation contacts Request site-specific inventory commitments and escalation contacts
Evidence to request Service-location list, escalation path, and sample service report Contractual SLA, service map, and parts availability report Contractual SLA, subcontractor list, service map, and parts availability report
Reliability and operational risk
Illustrative availability SLA target 99.5% 99.9% 99.95%
SLA details to verify Define measurement period, exclusions, remedies, and whether the SLA covers hardware only Confirm maintenance exclusions, incident severity definitions, and service-credit terms Confirm measurement method, covered components, exclusions, remedies, and claim process
Reliability evidence to request Failure and repair history for the quoted configuration, with reporting period and sample size Configuration-specific field data, component replacement rates, and repair-time history Auditable fleet data, failure definitions, sample size, and independent test documentation
Platform validation checks Confirm supported GPU, CPU, memory, firmware, operating-system, and fabric combinations; request thermal and power validation for the intended rack configuration.
Five-year total cost of ownership (USD)
Comparable system scope One equivalent 8-GPU AI server per option; prices below are illustrative assumptions for comparison, not market quotes.
Initial server purchase price $280,000 $310,000 $340,000
Annual support assumption 8% of purchase price per year 6% of purchase price per year 4% of purchase price per year
Five-year support cost $112,000 $93,000 $68,000
Five-year spare-parts allowance $14,000 $9,000 $6,000
Estimated energy cost over five years $58,867 $58,867 $58,867
Five-year TCO $464,867 $470,867 $472,867
TCO formula and assumptions Purchase price + five years of support + five-year parts allowance + energy. Energy assumes 8 kW average IT load, PUE 1.40, electricity at $0.12/kWh, and 8,760 hours per year. Taxes, financing, rack space, networking, software, staffing, and workload-related performance differences are excluded.
Commercial checks before selection Obtain firm quotes for the same bill of materials and service scope. Confirm renewal pricing, warranty exclusions, shipping and labor charges, parts-return terms, energy measurement basis, and any required support-tier upgrades.

Important: The supplier profiles, SLA targets, and cost figures are illustrative comparison inputs, not verified performance or pricing for any specific manufacturer. Replace them with contract terms, site-specific coverage confirmations, and comparable written quotations.

FAQS

How should I use training benchmark results when comparing AI servers?

Treat them as evidence, not a shopping list. Compare identical workloads and target quality. A faster result may not match your model.

Which system details should I verify?

Check accelerator count, memory, interconnects, and software settings. Also confirm the tested configuration matches the offered server. Small differences matter.

How can I validate a vendor’s performance claim?

Request repeatable tests with your model and dataset. A live demonstration is useful. Record scores, configurations, and submission notes side by side.

What should I test beyond a headline benchmark score?

Review utilization logs, repeat runs, sustained training, cooling, scheduling, and recovery after failure. Predictable completion may matter more than a narrow lead.

How much power can a high-density AI rack require?

A rack near 120 kilowatts needs measured-load planning. At 415 volts, three-phase power, it draws about 167 amps per phase.

What facility checks are important before deployment?

Confirm usable capacity for UPS systems, panels, busways, and branch circuits. Include power factor, conversion losses, redundancy, and future load changes. Leave room.

How should I plan cooling for a 120-kilowatt rack?

Expect roughly 409,000 Btu per hour of heat. Evaluate direct liquid cooling, coolant flow, leak detection, and service access. Paper designs can mislead.

What should a five-year ownership model include?

Include purchase cost, electricity, cooling, maintenance, software, and downtime. Use measured workload power, not only peak specifications. Small gaps compound.

How can I evaluate service reliability?

Ask for written response times, regional parts locations, escalation paths, and support hours. Check failure rates, burn-in procedures, firmware updates, and replacement stock.

What mistakes should buyers avoid?

Do not trust unclear configurations or average power figures alone. Keep contingency funds for delayed parts and cooling changes. Spreadsheets miss surprises.

Conclusion

Choosing a data center ai server manufacturer starts with defining the workloads the systems must support, estimating GPU requirements, and planning for future growth. Compare vendors using relevant performance evidence, including MLPerf Training v5.0 results, while checking that configurations align with your model sizes, throughput targets, and deployment needs. For high-density deployments, account for the substantial power demands of racks rated near 120 kW, along with the facility upgrades needed to supply power safely and consistently.

Cooling design is equally important: assess efficiency against an industry reference such as Uptime Institute’s reported average PUE of 1.56, while considering local operating conditions and uptime goals. Before deciding, verify service coverage, component reliability, and support response times. Finally, compare the five-year total cost of ownership, including hardware, energy, cooling, maintenance, and expansion. A well-rounded evaluation can help ensure the selected systems meet performance targets without exceeding operational or budget constraints.

Amelia

Amelia

Amelia is a seasoned marketing professional with a wealth of expertise in our company’s core offerings. With an unwavering passion for driving growth and innovation, she plays a pivotal role in shaping our marketing strategies and enhancing brand visibility. A key aspect of her responsibilities......